NYC Citi Bike Streaming Pipeline
Key objectives of the project include:
- Redpanda: Ingest real time data from NYC Citi Bike, station information and station_status
- Apache Spark – Stream processing engine
- PostgreSQL – Streaming data storage
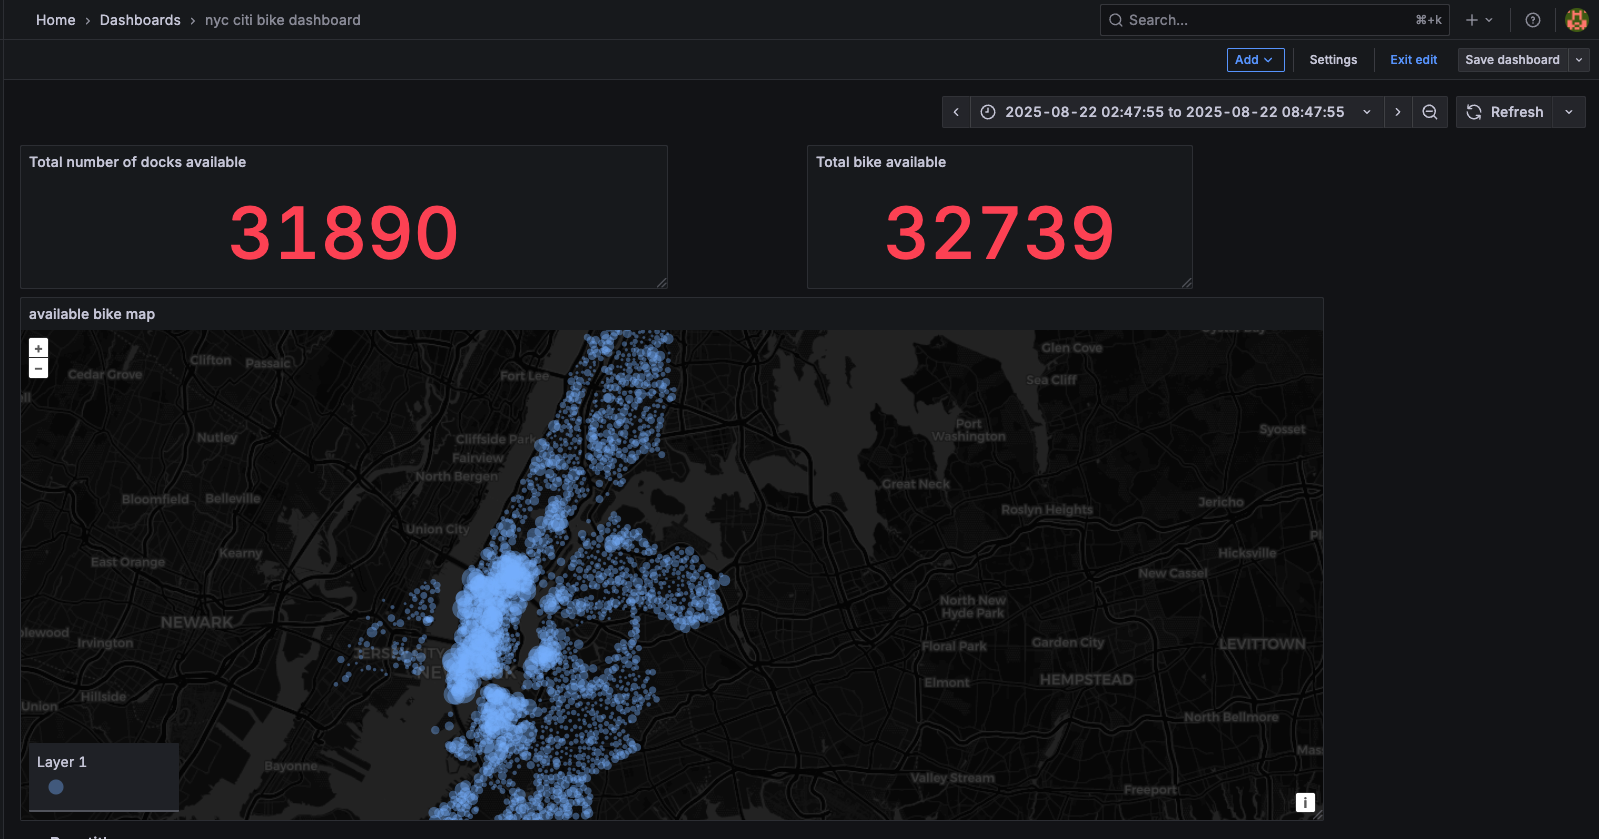
- Grafana – Real-time dashboard visualization showing real time total docks and bikes available, and a live map of stations with availability bike number.
Installation & Deployment
docker-compose.yml file to spin up services for this project can be found here
-
git clone https://github.com/sophie3101/data_projects.git
-
cd data_projects/03_nyc_citi_bike_streaming
-
docker compose up –build –remove-orphans -d
-
Send streaming data to Redpanda:
Run the following commands to produce station data into Redpanda:
docker exec -it python-client python src/producers/load_station_info.py docker exec -it python-client python src/producers/load_station_status.py -
Start Spark streaming jobs to consume and load data into PostgreSQL
Run an interactive Spark container
docker run --rm -it -e SPARK_MASTER="spark://spark-master:7077" -v $PWD/src/spark:/app --network 03_nyc_citi_bike_streaming_default -p 4040:4040 docker.io/bitnami/spark /bin/bashOnce inside the container, run the following Spark jobs:
spark-submit \ --packages org.apache.spark:spark-sql-kafka-0-10_2.13:4.0.0 \ --master spark://spark-master:7077 \ --jars /app/postgresql-42.7.6.jar \ /app/station_info_spark.py station_info spark-submit \ --packages org.apache.spark:spark-sql-kafka-0-10_2.13:4.0.0 \ --master spark://spark-master:7077 \ --jars /app/postgresql-42.7.6.jar \ /app/station_status_spark.py station_status -
Visualize live data in Grafana.
- Go to http://localhost:3000/
- Log in with default credentials (set up in docker-compose.yml file): admin for username/ admin for password
- In the Connections tab, choose postgres as connection.
- Then go to Dashboards, create new Dashboard and use following SQL queries for visualizations:
 WITH cte AS (
     SELECT station_id, num_bikes_available,num_docks_available,
     ROW_NUMBER()OVER(PARTITION BY station_id ORDER BY event_time DESC ) AS rnk
     FROM station_status
 )

 -- total dock available
 SELECT
     SUM(num_docks_available)
 FROM cte
 JOIN station_info
     ON station_info.station_id = cte.station_id
 WHERE cte.rnk =1

 -- total bik available
 SELECT
     station_info.name,
     station_info.longitude,
     station_info.latitude,
     cte.num_bikes_available
 FROM cte
 JOIN station_info
     ON station_info.station_id = cte.station_id
 WHERE cte.rnk =1

 --
📍 More details of the project can be found: github_link